• FREE SHIPPING AND RETURNS • 10% DISCOUNT WITH CODE: WELCOME10
• FREE SHIPPING AND RETURNS • 10% DISCOUNT WITH CODE: WELCOME10
• FREE SHIPPING AND RETURNS • 10% DISCOUNT WITH CODE: WELCOME10
• FREE SHIPPING AND RETURNS • 10% DISCOUNT WITH CODE: WELCOME10
• FREE SHIPPING AND RETURNS • 10% DISCOUNT WITH CODE: WELCOME10
• FREE SHIPPING AND RETURNS • 10% DISCOUNT WITH CODE: WELCOME10
• FREE SHIPPING AND RETURNS • 10% DISCOUNT WITH CODE: WELCOME10
• FREE SHIPPING AND RETURNS • 10% DISCOUNT WITH CODE: WELCOME10

Take a deep
breath
And then enjoy freely everything that makes you feel good: your home, your passions, the people you love. Meanwhile, Radoff monitors the air quality in your environments, keeping it healthy and safe. Thanks to advanced monitoring systems, Radoff protects you from pollution and ensures a clean environment.
Speak. Smile.


Look around you. Work.
Look around.
Look around.
Work.

Eat, move.
Work. Eat, move.


Rest, start again.
Rest, start again.
Build, imagine. Take a breath.
Rest, start again.
Take a breath.


Build, imagine.
Build, imagine. Take a breath.
Radoff takes care of the air you need.
Radoff takes care of the air.
Radoff takes care of the air you need,
monitoring it and protecting you from pollution.
what you need, by monitoring it and
monitoring it and
protecting you
from pollution.
protecting you from pollution.


We help you create healthy environments.

Live your space
At home, Radoff monitors air quality in real time, keeping track of AQI levels and detecting the presence of key pollutants.

Live your space
At home, Radoff monitors air quality in real time, keeping track of AQI levels and detecting the presence of key pollutants.

Live your space
At home, Radoff monitors air quality in real time, keeping track of AQI levels and detecting the presence of key pollutants.

Improve your environment
In shared spaces, Radoff combines continuous monitoring and automatic air quality remediation, effectively covering areas up to 70 sqm.

Improve your environment
In shared spaces, Radoff combines continuous monitoring and automatic air quality remediation, effectively covering areas up to 70 sqm.

Improve your environment
In shared spaces, Radoff combines continuous monitoring and automatic air quality remediation, effectively covering areas up to 70 sqm.

Being well together
Radoff offers indoor air quality monitoring and remediation systems—a true social challenge to ensure healthier air and safer spaces.

Being well together
Radoff offers indoor air quality monitoring and remediation systems—a true social challenge to ensure healthier air and safer spaces.

Being well together
Radoff offers indoor air quality monitoring and remediation systems—a true social challenge to ensure healthier air and safer spaces.
Monitor. Remediate. Breathe. Live.
3 products that improve the quality of your spaces.
Monitor. Remediate.
Breathe. Live.
3 products that improve the quality of your spaces.
Compatible with other smart home devices
Connected with Alexa: ask for real-time AQI information in your home and get notified when air quality starts to decline.
Compatible with other smart home devices
Connected with Alexa: ask for real-time AQI information in your home and get notified when air quality starts to decline.
Certified Radon Sensor ENEA
Unique and innovative technology protected by 34 patents. ENEA, the leading body in the field of ionizing radiation, has calibrated and certified the effectiveness of our devices.
Certified Radon Sensor ENEA
Unique and innovative technology protected by 34 patents. ENEA, the leading body in the field of ionizing radiation, has calibrated and certified the effectiveness of our devices.
They detect the main air pollutants.
Measure the levels of radon gas (Rn), fine particles (PM), volatile organic compounds (TVOC), carbon dioxide (CO2), atmospheric pressure, temperature, and humidity.
They detect the main air pollutants.
Measure the levels of radon gas (Rn), fine particles (PM), volatile organic compounds (TVOC), carbon dioxide (CO2), atmospheric pressure, temperature, and humidity.
Products
Products
Free shipping and returns
Free shipping and returns

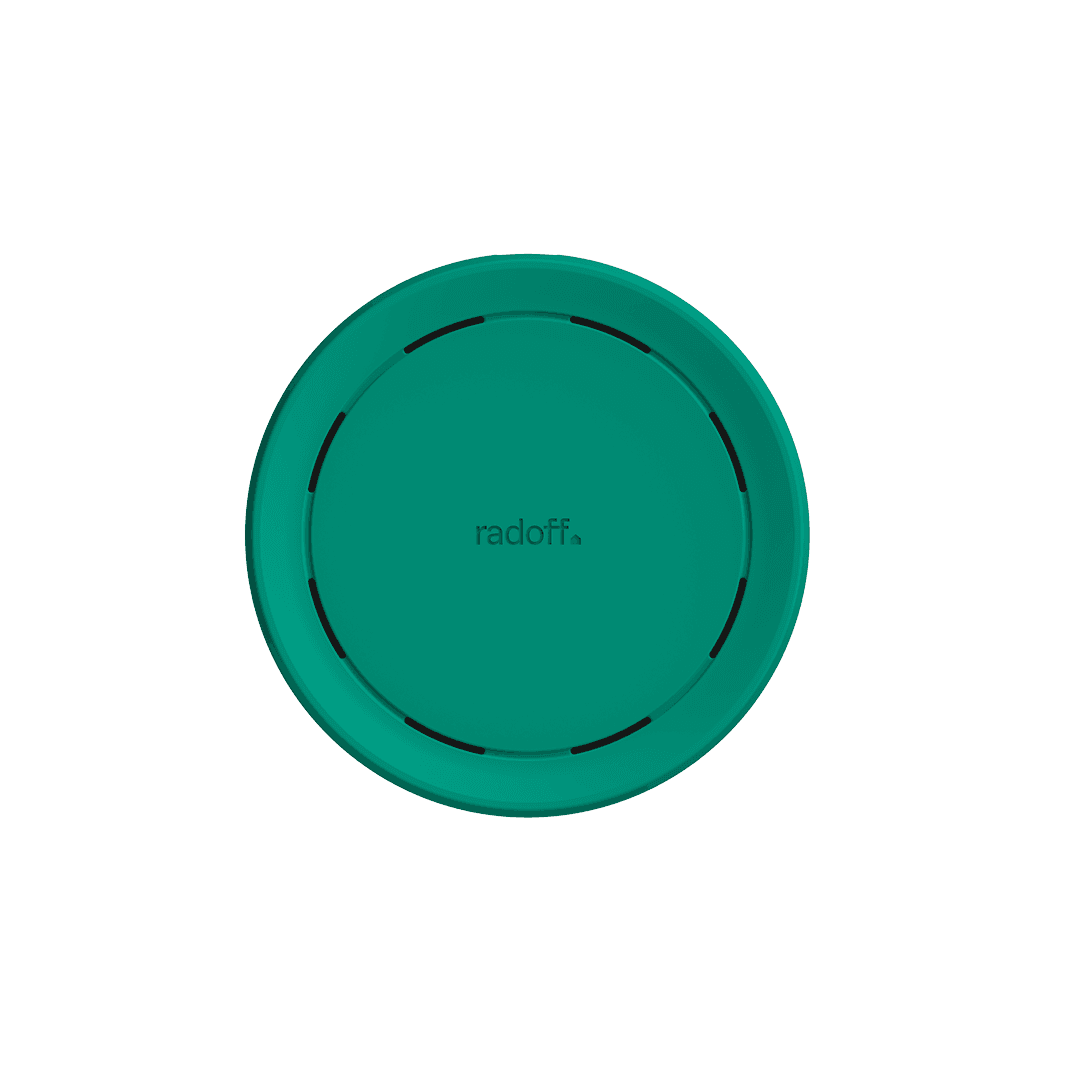
Radoff Now
Device for monitoring
Disponibile in verde e bianco

Radoff Now
Device for monitoring
Disponibile in verde e bianco

Radoff Now
Device for monitoring
Disponibile in verde e bianco

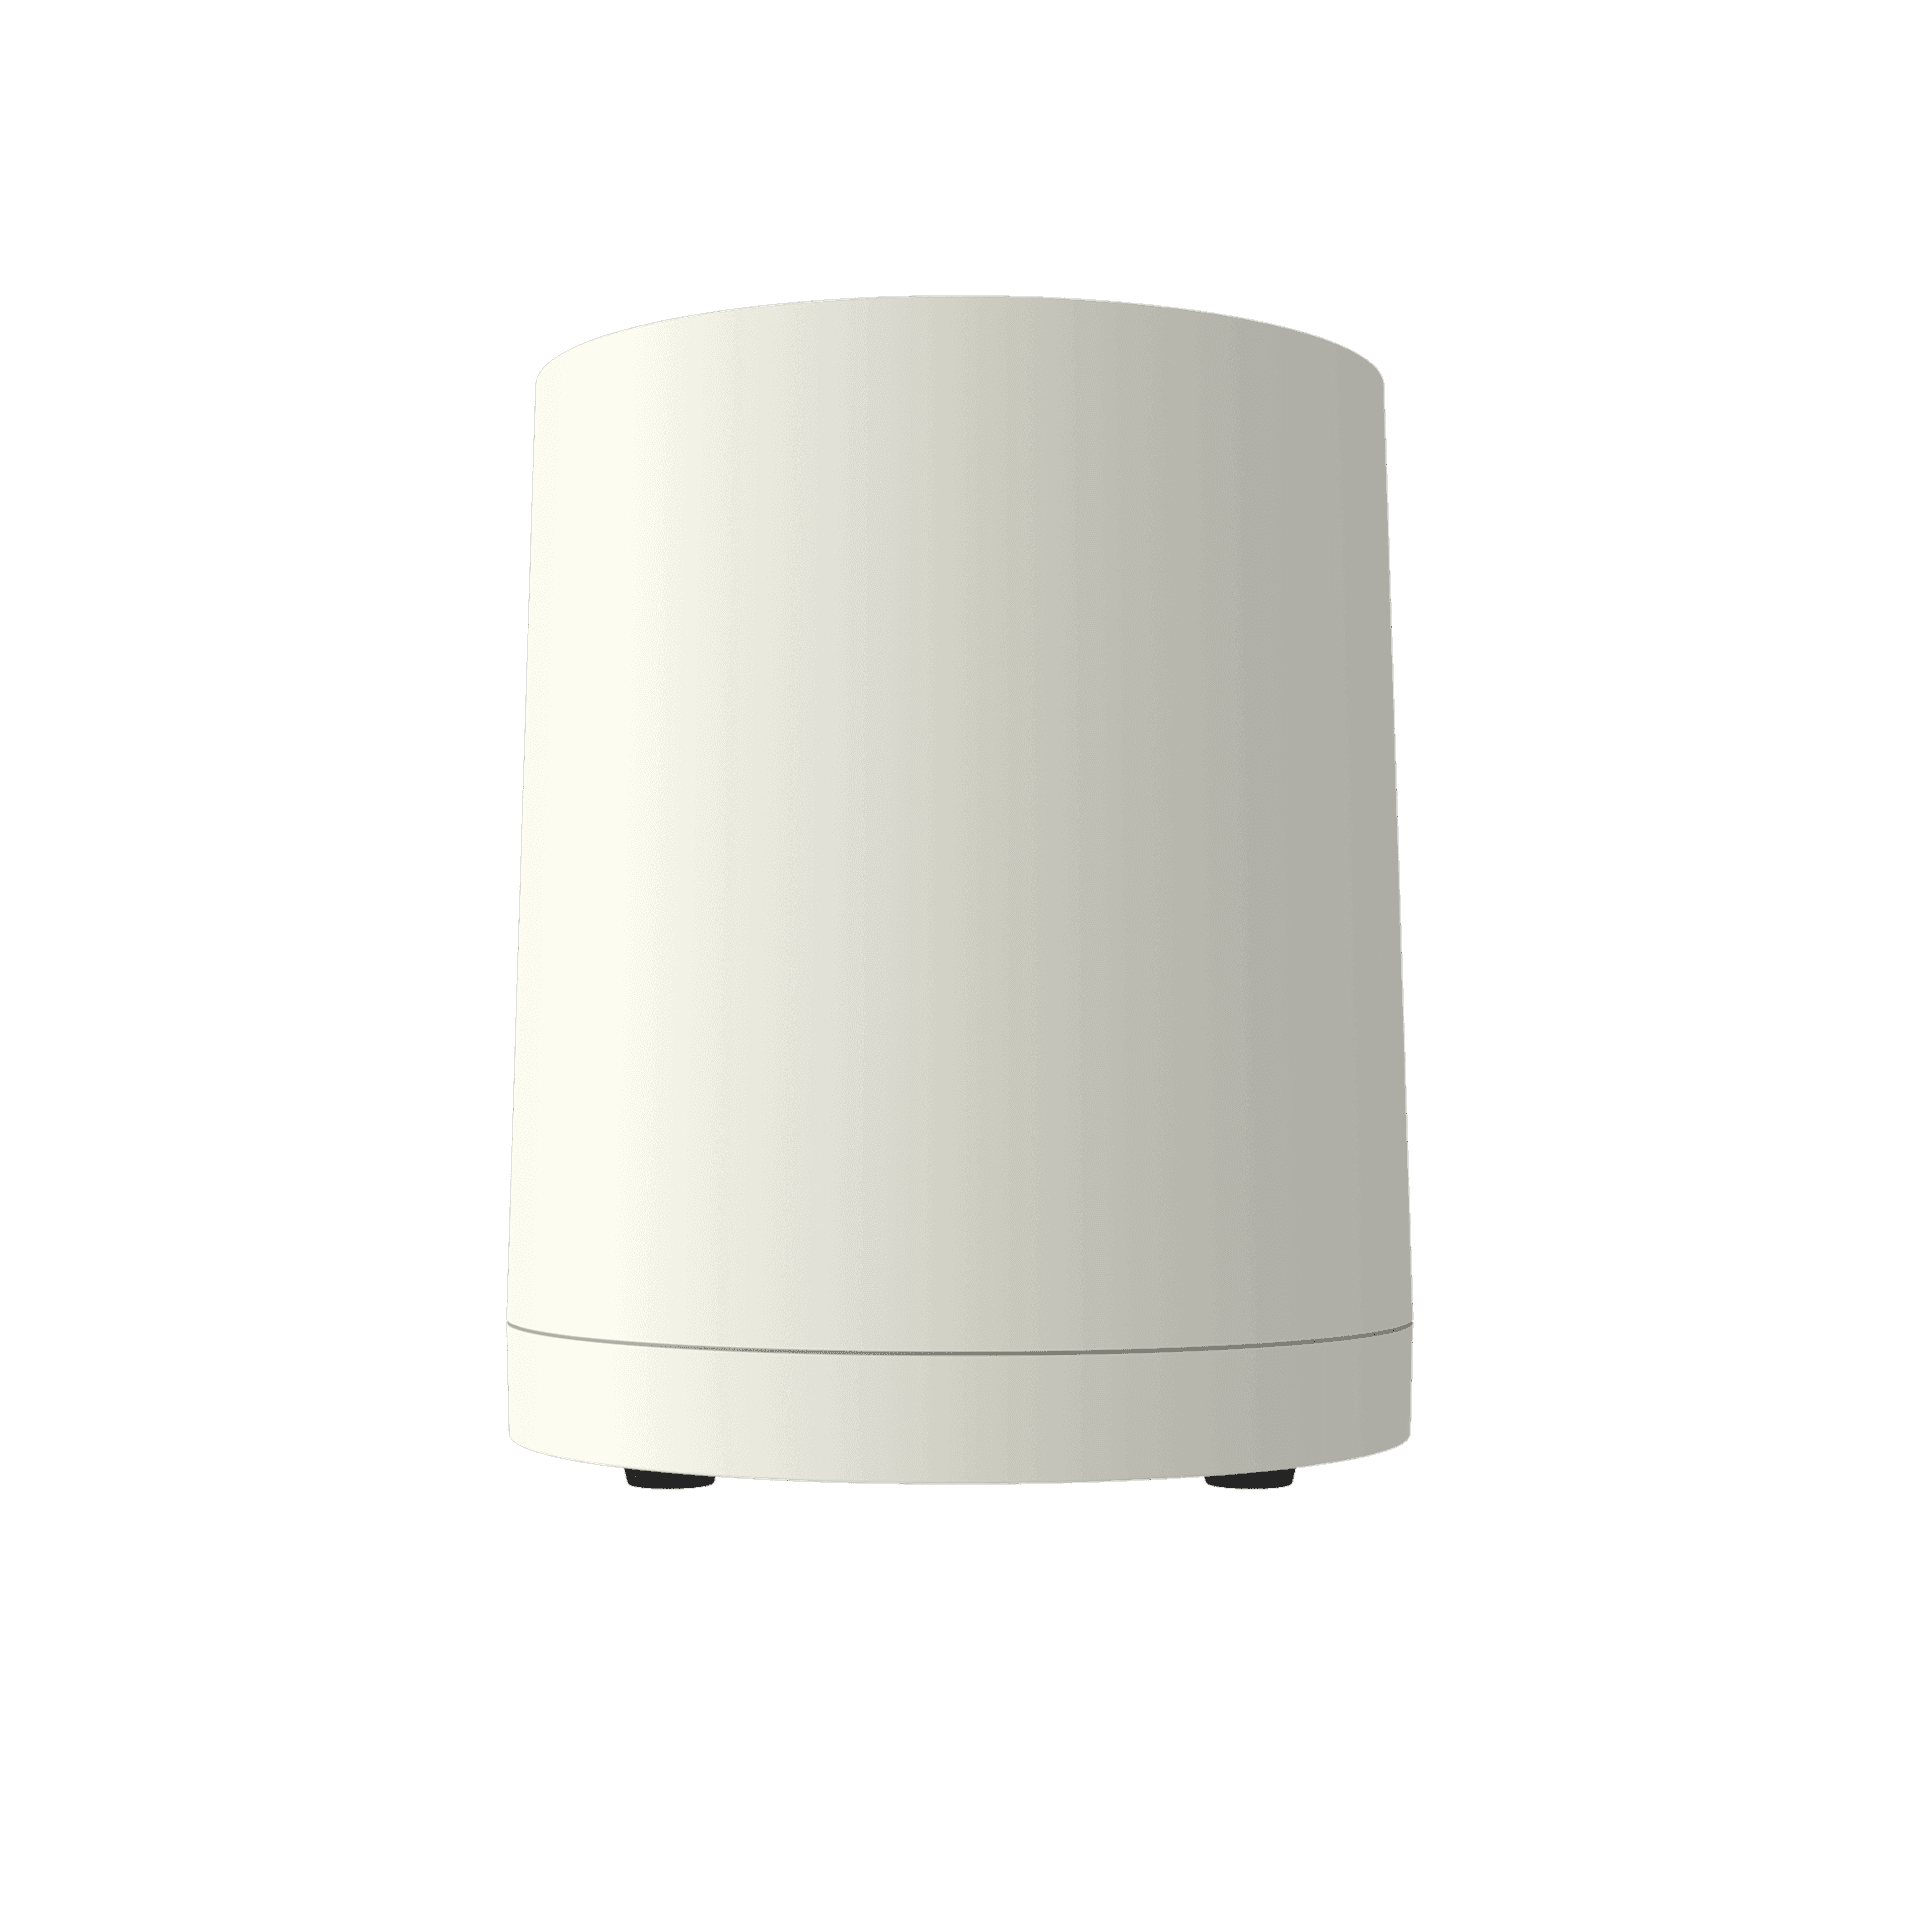
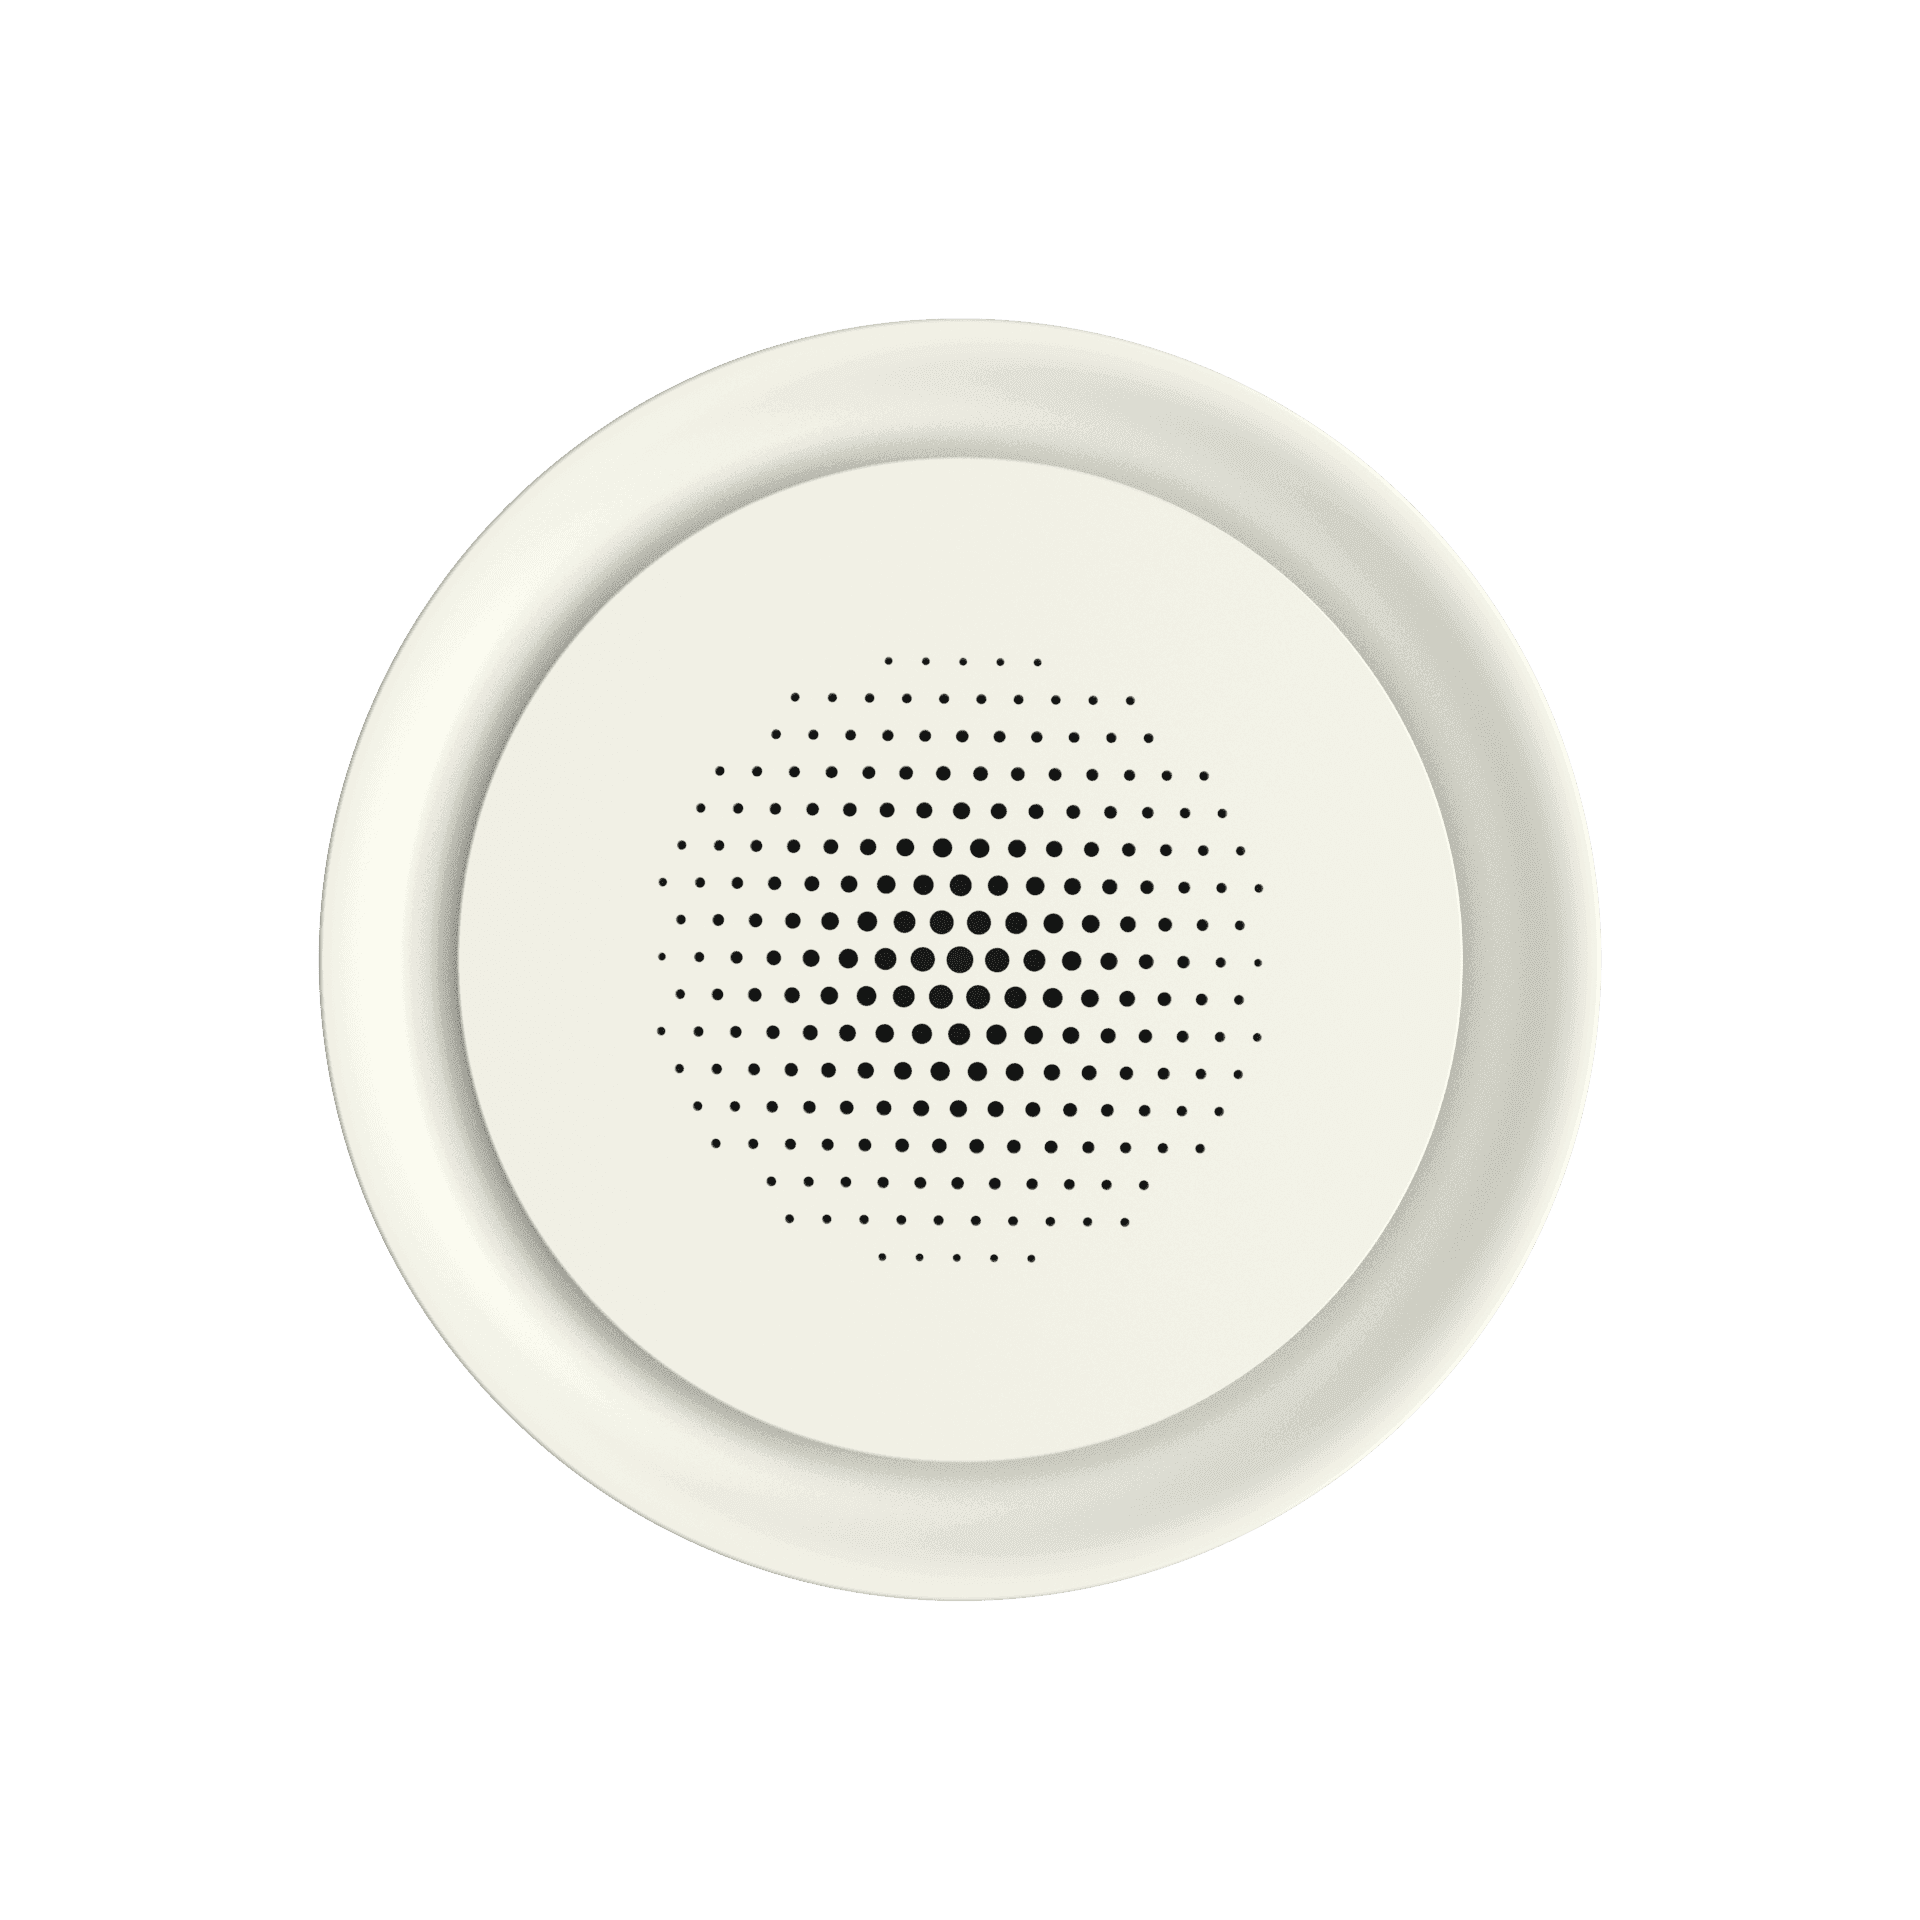
Radoff Sense
Device for advanced monitoring
Available in white and black.

Radoff Sense
Device for advanced monitoring
Available in white and black.

Radoff Sense
Device for advanced monitoring
Available in white and black.

Radoff Life
Dispositivo per la bonifica degli ambienti

Radoff Life
Dispositivo per la bonifica degli ambienti

Radoff Life
Dispositivo per la bonifica degli ambienti
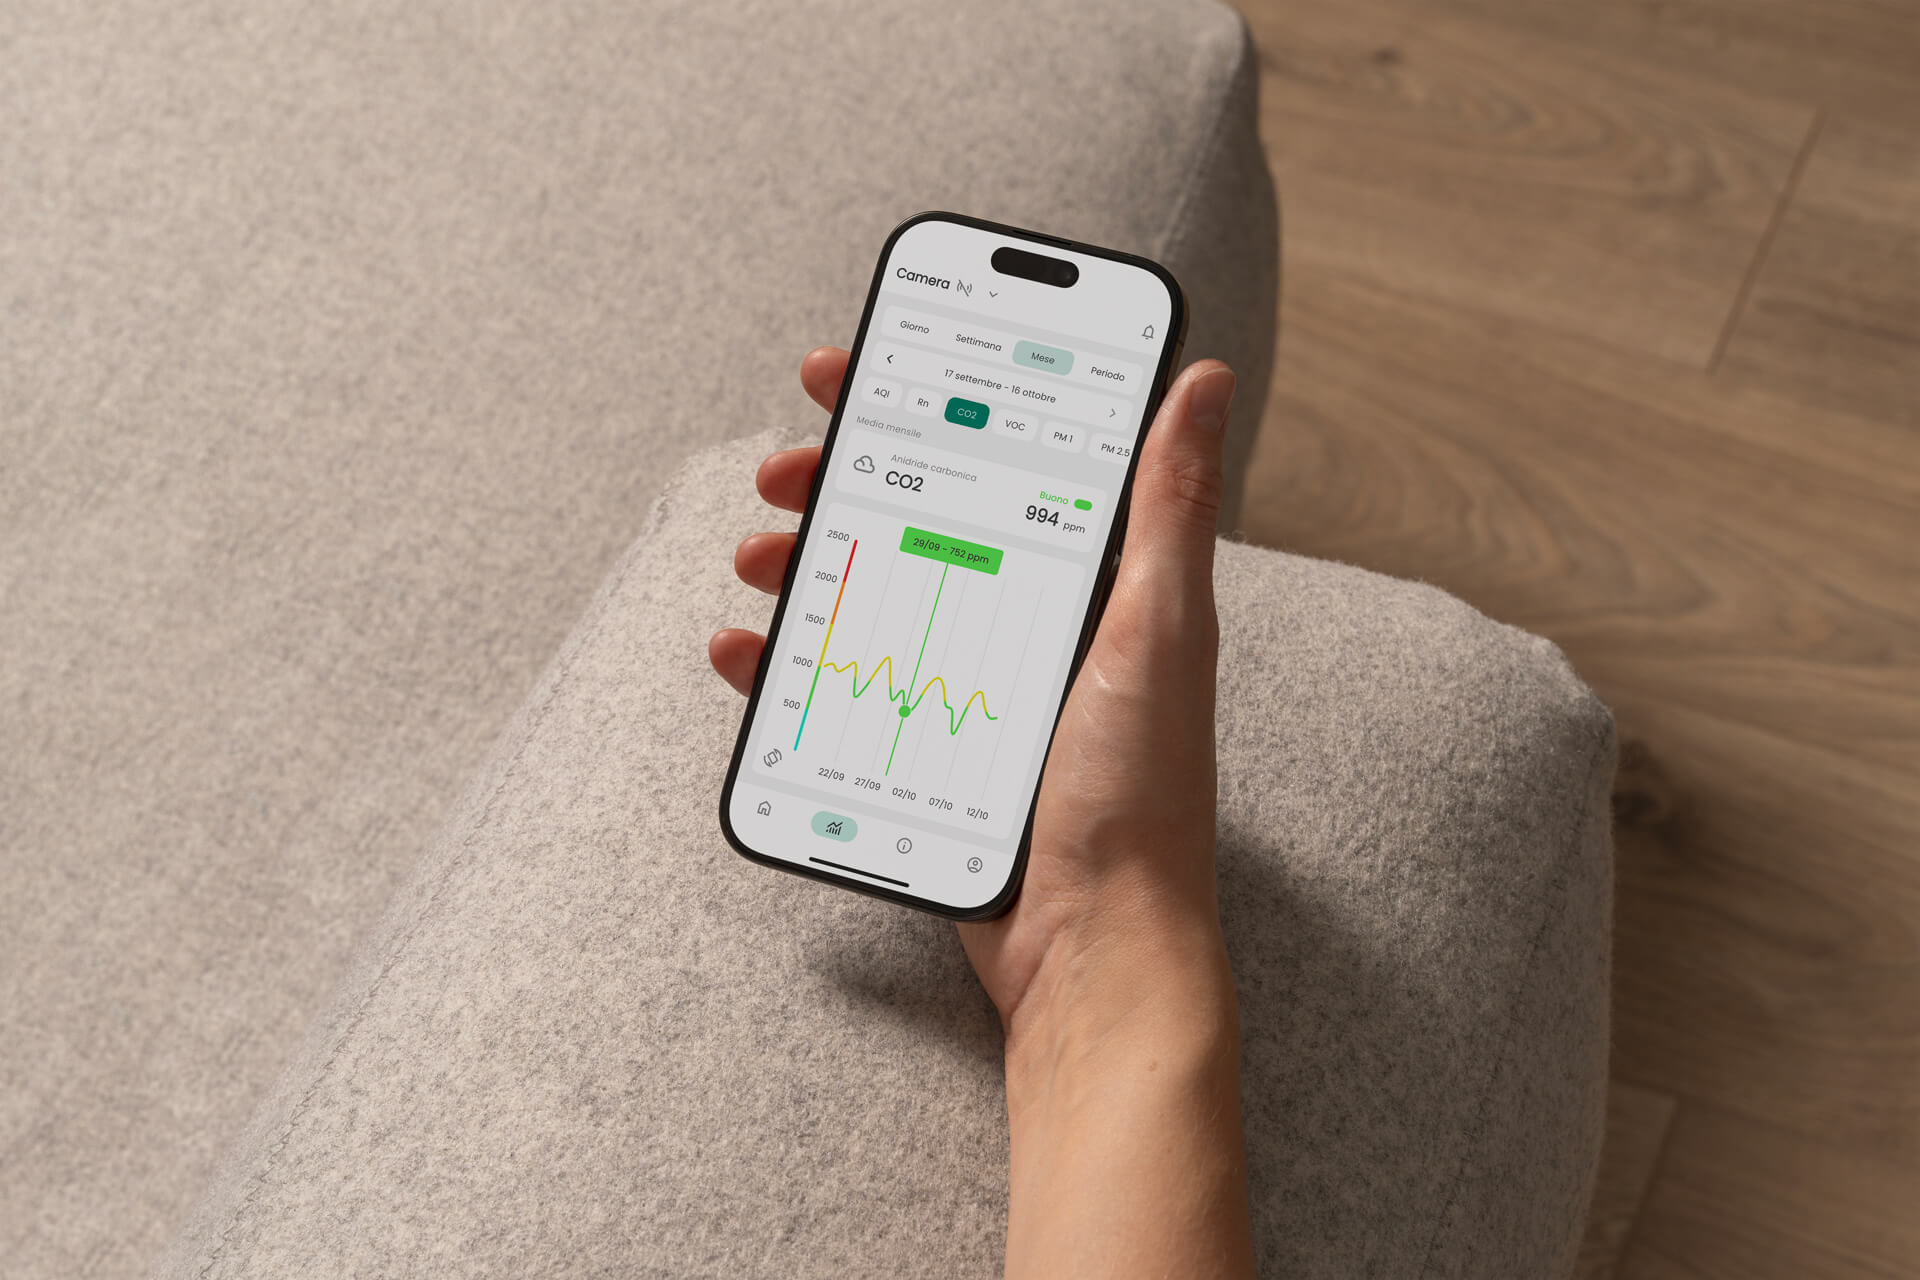
Radoff App. Take control of your well-being.
Manage Radoff systems through the app that keeps you updated at all times on the air quality in the environments where you live or work. Available for iOS and Android.

Radoff App. Take control of your well-being.
Manage Radoff systems through the app that keeps you updated at all times on the air quality in the environments where you live or work. Available for iOS and Android.

Radoff App. Take control of your well-being.
Manage Radoff systems through the app that keeps you updated at all times on the air quality in the environments where you live or work. Available for iOS and Android.

Where the winds blow
Where the winds blow
Where the winds blow
Products
Company
Download our app
© Radoff S.p.A. | Capital: €4,330,779.78 | VAT: 03735831202 | REA: SS-205494
Products
Company
© Radoff S.p.A. | Capital: €4,330,779.78 | VAT: 03735831202 | REA: SS-205494
Products
Company
Download our app
© Radoff S.p.A. | Capital: €4,330,779.78 | VAT: 03735831202 | REA: SS-205494


